When assessing the effectiveness of WordPress speed optimization plugin(s) it’s important that you correctly measure website page loading time.
In this article, we will show you how to correctly measure your website page loading time.
There are many online website speed test tools that you can use. However, all of these online sites present you with results that may be difficult to understand and interpret for non-tech and home users.
But one of the most popular and valid tools is the Pingdom tools for website speed tests. It is one of the most popular website performance monitoring tools.
It is easy to use and also allows you to select different geographical locations to run a test which is really handy, this allows you to assess how your site performs in different parts of the world.
How is your website doing? how often do you check your website’s page load time? Are you measuring the load time correctly?
If you have the answers to these questions then you don’t need to read this post. But if you are in doubt read on to know how to measure your website’s page load time correctly.
In the Test from box click on the arrow and choose the location closest to your web server and not your own physical location if the server is located there.
Then click “Start test”
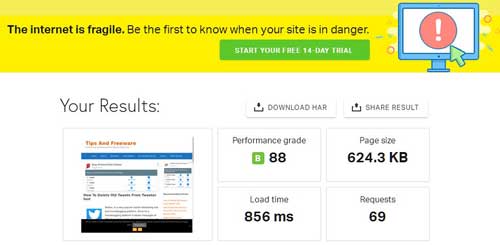
Pingdom will then test your website (the URL you typed) and give you a summary of your site’s performance with 4 metrics.
Of these 4 metrics, the most important is the Load time. The performance grade is a general guideline of how well your website is optimized for speed. It’s really not very important to score a perfect 100 there, though no harm in trying.
Because! The speed at which your site loads is really the only number that matters. When Google is analyzing your site, it does not care or know about the performance grade, only the loading time.
You should run the test several times preferably three times, to get an average loading time. As you will see that every test will give you different results.
Here is an example of my site tested in Pingdom tools 1st. Test report. before the test, I have deleted the cache plugin cache, browser cache, and also purged Cloudflare CDN cache.
Second test report
As you can see from these two reports, there is no change in the performance grade, but a huge difference in the page load time. The first test load time is 2.32 seconds but the second test load time shows 856 ms.
Why the first test result may not be correct
This is because in the first test Pingdom bot was served with a non-cached version of my site. The first visit triggers the cache to be rebuilt. The second visit by the Pingdom bot is served with a faster-cached version of the page, the page load time improves considerably.
If you have just installed a cache plugin like wp Super cache, or have changed any settings in your caching plugin, the first visitor ( that includes bots, also Pingdom bot) will be served a non-cached version of the page.
This first visit will cause the cache to be generated, so the second visitor will get the faster-cached version of the page.
So when you run the website speed test tool, the first result could possibly be on an uncached version of the page which is why it’s important to run the test a few times.
Another example: page load time tested with the GTMetrix tool.
First test report (all cache cleared as above)
Second Test report on GTMetrix.
As you can see there is no change in the Performance score, but a huge improvement in the page load time.
Ironically most website owners and bloggers only test the homepage of their site, which may have more content on it than a regular post page. So when testing website loading speed considers testing different content pages of your site.
This is because your site is most likely to be visited from a search engine result which will be a blog post and not necessarily the homepage.
So it’s important to test the performance of all pages, this will give you a general idea of how fast your site is as a whole.
Do a Benchmarking test
Do a test on how much improvement you are getting from your cache plugin. First, run the above test without any cache plugin active. Take the average page loading time.
Then install or activate the cache plugin with its most basic configuration and run the test a few more times, get the average, and compare the two.
The next step is to activate other advanced options in the cache plugin and run the tests again.
After you activate a new option in the cache plugin you need to see if it has an impact on your page load time. This will also give you an idea of which options of the cache plugin work best for your site.
This is because additional options such as minification and other advanced options may have the potential to conflict with themes, plugins, and server configurations and should be used cautiously.
So testing after every change lets you isolate a particular feature that may be causing an issue and may even slow down your site.
This is true of cache plugins like WP Rocket, W3 Total cache, or any other caching plugins you may use.
Also, make sure that you don’t have more than one cache plugin running on your site. For example, even if WP Super Cache is installed but not activated, it can still interfere.
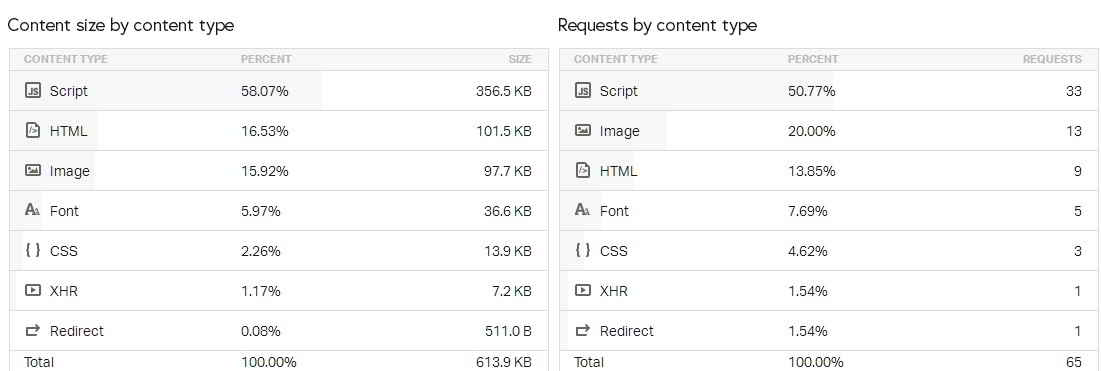
The Content size by content type table in the Pingdom tool result shows you the loading time and size of each component of your page – all the various image files, CSS, Javascript files, etc. that are loaded each time someone visits your page.
To reduce the page size by minifying CSS, JS, and HTML, the Autoptimize plugin is one of the best there is. With the best Autoptimize settings you can further improve the website’s page load time.
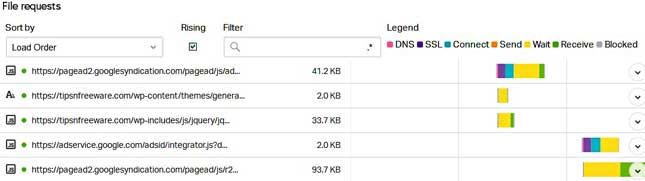
File requests
External scripts such as those served from third-party ad servers, sites displaying Google Adsense are probably your biggest enemy here. These scripts are served from a third-party source, they can not be cached and you can do nothing about that.
Conclusion:
Since Website Page Load Time is very important for ranking in SERP and more than 48% of users expect a webpage to load within 2 seconds! you can not afford to ignore the loading time of your site.
This is something you have to keep monitoring on a regular basis and measure website page load time periodically.
Pingdom is a reliable tool to measure your Website Page Load Time, and it’s very easy to use. With this tool, you can test and measure the most important metrics of your website and make sure they are running fast.
You can use this same procedure with other tools available to measure website page load time. Like GTMetrix, Google Pagespeed, Webpage speed test. Its individual preference.
Hello! I am Ben Jamir, Founder, and Author of this blog Tipsnfreeware. I blog about computer tips & tricks, share tested free Software’s, Networking, WordPress tips, SEO tips. If you like my post /Tips then please like and share it with your friends.
We use cookies on our website to give you the most relevant experience by remembering your preferences and repeat visits. By clicking “Accept”, you consent to the use of ALL the cookies.
This website uses cookies to improve your experience while you navigate through the website. Out of these cookies, the cookies that are categorized as necessary are stored on your browser as they are as essential for the working of basic functionalities of the website. We also use third-party cookies that help us analyze and understand how you use this website. These cookies will be stored in your browser only with your consent. You also have the option to opt-out of these cookies. But opting out of some of these cookies may have an effect on your browsing experience.
Necessary cookies are absolutely essential for the website to function properly. This category only includes cookies that ensures basic functionalities and security features of the website. These cookies do not store any personal information.


")
")


